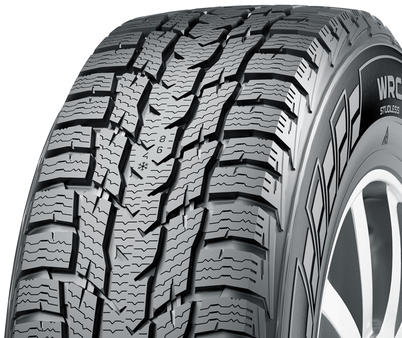
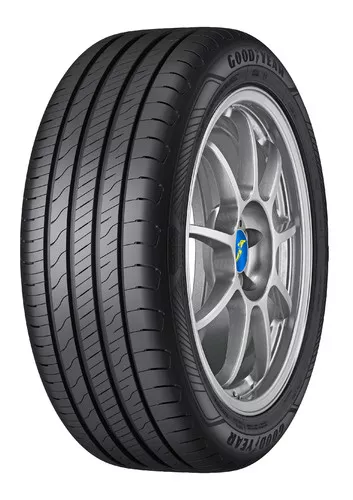
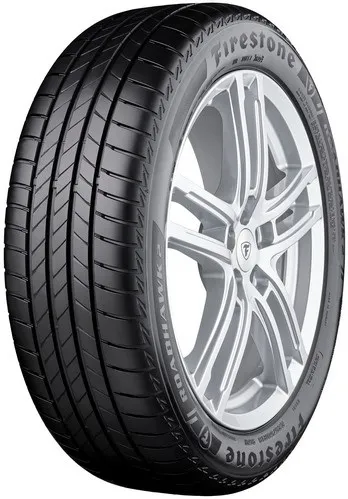
Vergleich: Nokian WR C3 gegen Goodyear Efficient Grip Performance 2 gegen Firestone Roadhawk 2
Auch vergleichen mit


 Nokian WR C3Goodyear Efficient Grip Performance 2Firestone Roadhawk 2Nokian WR C3Goodyear Efficient Grip Performance 2Firestone Roadhawk 2Nokian WR C3Goodyear Efficient Grip Performance 2Firestone Roadhawk 2Nokian WR C3Goodyear Efficient Grip Performance 2Firestone Roadhawk 2Nokian WR C3Goodyear Efficient Grip Performance 2Firestone Roadhawk 2Nokian WR C3Goodyear Efficient Grip Performance 2Firestone Roadhawk 2Nokian WR C3Goodyear Efficient Grip Performance 2Firestone Roadhawk 2Nokian WR C3Goodyear Efficient Grip Performance 2Firestone Roadhawk 2Nokian WR C3Goodyear Efficient Grip Performance 2Firestone Roadhawk 2Nokian WR C3Goodyear Efficient Grip Performance 2Firestone Roadhawk 2Nokian WR C3Nokian WR C3Goodyear Efficient Grip Performance 2Firestone Roadhawk 2Nokian WR C3Goodyear Efficient Grip Performance 2Firestone Roadhawk 2Nokian WR C3Goodyear Efficient Grip Performance 2Firestone Roadhawk 2Nokian WR C3Goodyear Efficient Grip Performance 2Firestone Roadhawk 2
Preise in allen verfügbaren reifendimensionen dieser reifen vergleichen.