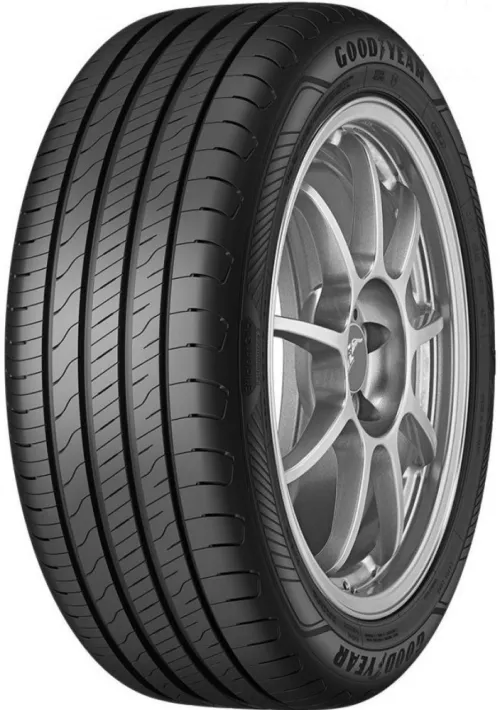
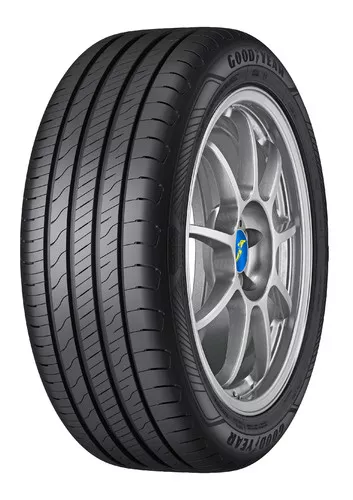
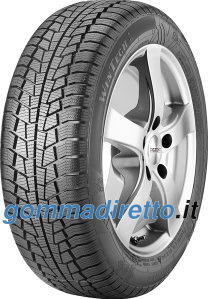
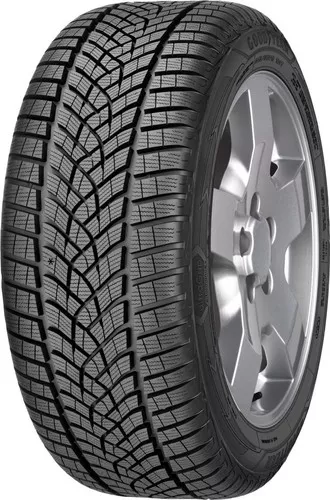
Vergleich: GoodYear Efficientgrip Performance 2 gegen Goodyear Efficient Grip Performance 2 gegen Viking WinTech gegen GoodYear UltraGrip Performance+ gegen Continental UltraContact NXT
Auch vergleichen mit


 GoodYear Efficientgrip Performance 2Goodyear Efficient Grip Performance 2Viking WinTechGoodYear UltraGrip Performance+Continental UltraContact NXTGoodYear Efficientgrip Performance 2Goodyear Efficient Grip Performance 2Viking WinTechGoodYear UltraGrip Performance+Continental UltraContact NXTGoodYear Efficientgrip Performance 2Goodyear Efficient Grip Performance 2Viking WinTechGoodYear UltraGrip Performance+Continental UltraContact NXTGoodYear Efficientgrip Performance 2Goodyear Efficient Grip Performance 2Viking WinTechGoodYear UltraGrip Performance+Continental UltraContact NXTGoodYear Efficientgrip Performance 2Goodyear Efficient Grip Performance 2Viking WinTechGoodYear UltraGrip Performance+Continental UltraContact NXTGoodYear Efficientgrip Performance 2Goodyear Efficient Grip Performance 2Viking WinTechGoodYear UltraGrip Performance+Continental UltraContact NXTGoodYear Efficientgrip Performance 2Goodyear Efficient Grip Performance 2Viking WinTechGoodYear UltraGrip Performance+Continental UltraContact NXTGoodYear Efficientgrip Performance 2Goodyear Efficient Grip Performance 2Viking WinTechGoodYear UltraGrip Performance+Continental UltraContact NXTGoodYear Efficientgrip Performance 2Goodyear Efficient Grip Performance 2Viking WinTechGoodYear UltraGrip Performance+Continental UltraContact NXTGoodYear Efficientgrip Performance 2Goodyear Efficient Grip Performance 2GoodYear UltraGrip Performance+Continental UltraContact NXTGoodYear Efficientgrip Performance 2Goodyear Efficient Grip Performance 2GoodYear UltraGrip Performance+Continental UltraContact NXTGoodYear Efficientgrip Performance 2Goodyear Efficient Grip Performance 2Viking WinTechGoodYear UltraGrip Performance+Continental UltraContact NXTGoodYear Efficientgrip Performance 2Goodyear Efficient Grip Performance 2Viking WinTechGoodYear UltraGrip Performance+Continental UltraContact NXTGoodYear Efficientgrip Performance 2Goodyear Efficient Grip Performance 2GoodYear UltraGrip Performance+GoodYear Efficientgrip Performance 2Goodyear Efficient Grip Performance 2Viking WinTechGoodYear UltraGrip Performance+GoodYear Efficientgrip Performance 2Goodyear Efficient Grip Performance 2Viking WinTechGoodYear UltraGrip Performance+Continental UltraContact NXTGoodYear Efficientgrip Performance 2Goodyear Efficient Grip Performance 2GoodYear UltraGrip Performance+Continental UltraContact NXTGoodYear Efficientgrip Performance 2Goodyear Efficient Grip Performance 2Viking WinTechGoodYear UltraGrip Performance+
Preise in allen verfügbaren reifendimensionen dieser reifen vergleichen.